
Chapter 10: Externalities

Externalities are bystander effects, or additional costs or benefits that spillover to those other than the market participants themselves. To this point we have considered all costs and benefits to be fully borne by buyers and sellers. We simply defined the willingness to pay (marginal benefit) to buyers and the willingness to sell (marginal cost) to sellers, and compared these to the market price to determine any consumer or producer surplus. But there’s many situations that involve others. For example, factories often create pollution. We can think of pollution as a negative externality or an additional cost imposed on bystanders. There’s also positive externalities such as if there’s a public concert in the park and some of the music spills over and can be heard perhaps by diners seated outside on the patio of neighboring restaurant.
To account for these additional costs and benefits we need to separate out private benefits from external benefits and private costs from external costs. The private benefit goes to the buyer; the private cost is incurred by the seller (or producer). External benefits and/or costs accrue to bystanders and these are the externalities. If we want to measure the overall effect of the market activity we use the concept of social benefit and social cost. For example, the marginal private benefit accrues to buyers and the marginal external benefit accrues to bystanders and if we think of society as comprised of both, we define the marginal social benefit as the sum of the marginal private benefit and marginal external benefit.
For instance if the market demand is represented by P=12-2Q, which models the marginal private benefit curve, and there’s a constant positive external benefit of $3 per unit, we would model the marginal social benefit curve using P=15-2Q. Since there’s a positive externality of $3, we need the marginal social benefit to be exactly $3 higher than the marginal private benefit at all points:
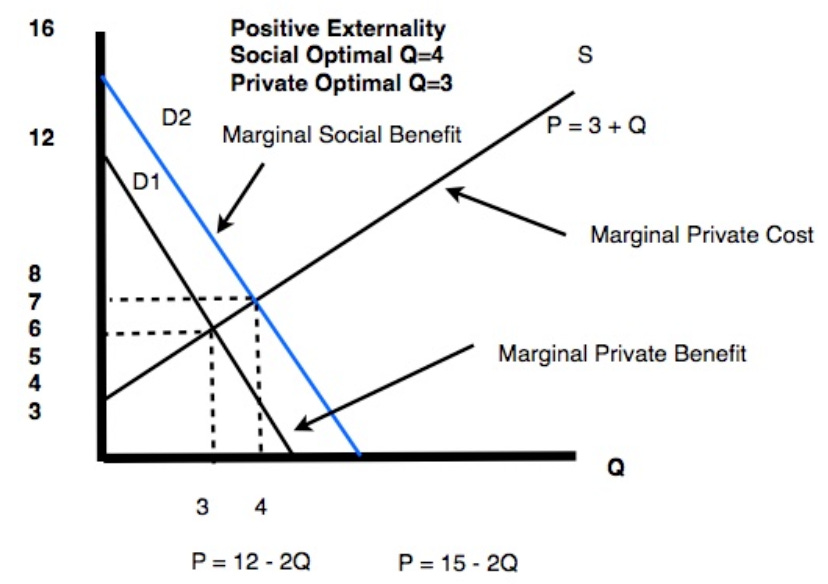
In the above graph I’ve assumed that the supply relationship (marginal cost curve) can be represented with P=3+Q. This being the case we can find the market equilibrium:
12-2Q = 3+Q yields 9 = 3Q and then Q*=3. This is the market equilibrium quantity. It’s the quantity of the good that will be produced when the market is left to its own devices and buyers and sellers only pay attention to their own private benefits and private costs. The socially efficient quantity is different! It’s found by comparing the marginal social benefit curve to the supply curve: 15 - 2Q = 3+Q yields 12 = 3Q and Q = 4. This is the socially efficient quantity. Any time there’s a positive externality, the socially efficient quantity will be higher than the market equilibrium quantity. This is a problem!
The problem exists because buyers and sellers in the market don’t observe or pay any attention to the effects on bystanders. They only care for their own interests. So the market provides the quantity that is optimal in the sense of matching marginal private benefit to marginal private cost. But since there’s positive spillover effects there’s reason to produce more…there’s bystanders that stand to gain above and beyond what the market participants are experiencing. But the bystanders are not themselves buyers—and officially they have no say in the market—they are passively affected.
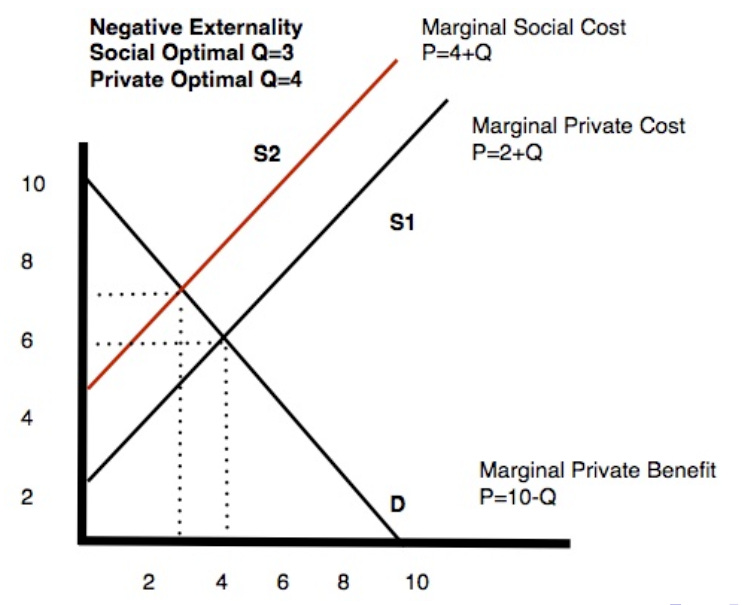
Similarly the marginal social cost is the sum of the marginal private cost and the marginal external cost. If the marginal private cost (supply curve) is represented with P=2+Q and there’s an additional constant cost of $2 per unit that’s imposed on bystanders, the marginal social cost curve will be P=4+Q. If we assume the demand relationship is given by P=10-Q then the market equilibrium quantity will be: 10-Q = 2+Q which yields: 8 = 2Q or Q*=4. But this ignores the additional harm to bystanders! The socially optimal quantity is found by equating the marginal social cost curve to the marginal private benefit curve: 10 - Q = 4+ Q or 6 = 2Q or Q=3.
The issue is that buyers and sellers don’t observe or care about the additional spillover effects on bystanders—so they produce too much relative to the interests of society. It’s not necessarily that the buyers and sellers are heartless and cruel or selfish or anything like that. The problem is far more difficult: The negative externality is non-salient and difficult to quantify. Market participants are simply not aware of the harms they’re causing and even if they become aware they’re unable to properly measure the extent of the harm or have any sense of how to mitigate those harms.
Welfare Effects of Externalities: In the presence of an externality the competitive market does not deliver the socially efficient outcome. If it’s a positive externality we get underproduction of the activity, and hence not enough of the spillover benefits to bystanders (externality). If it’s a negative externality we get overproduction of the activity, and hence too much of the spillover costs that harm bystanders (externality).
Economists use the concept of deadweight loss to quantify inefficiency. Basically deadweight loss measures the forgone economic gains that are unrealized due to the efficient quantity as opposed to the economic surplus maximizing (efficient) quantity.
The traditional graph depicts deadweight loss as entering whenever the demand curve is vertically higher than the supply curve, over units not produced. Take the following example:
Deadweight loss enters because consumers value those units more than they cost to produce, but nevertheless those units are not exchanged. We measure consumers’ valuations by their willingness to pay which is the same as their marginal benefit for the particular unit consumed—this is given by the vertical height of the demand curve. We measure sellers’ valuations (or their costs) by the willingness to sell which is the same as their marginal cost for the particular unit produced—this is given by the vertical height of the supply curve.
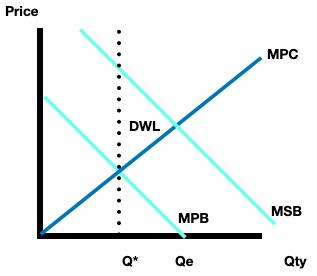
Here’s the graphical depiction for positive externality:
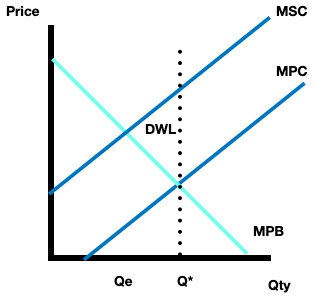
Here’s the graphical depiction for negative externality:
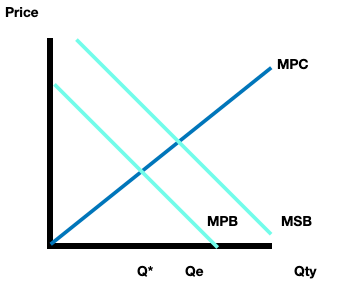
Here’s the graphical depiction of deadweight loss for positive externality:
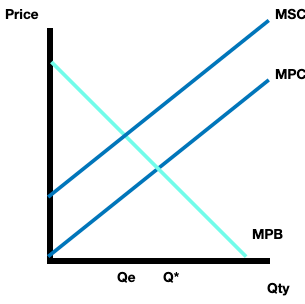
Here’s the graphical depiction of deadweight loss for negative externality:
Here is the video version:
Thanks for reading! Subscribe for free to receive new posts and support my work.